Dublin, 05.04.2025 – In the following I will present my findings from different analytics programs, in what way they benefit a website host and what else I could have theoretically gotten insights on.
So what tools did I use? I downloaded the plugin “Google Site Kit”, which offered a mix out of Google search console and analytics, as well as looking at my in-app LinkedIn analytics.
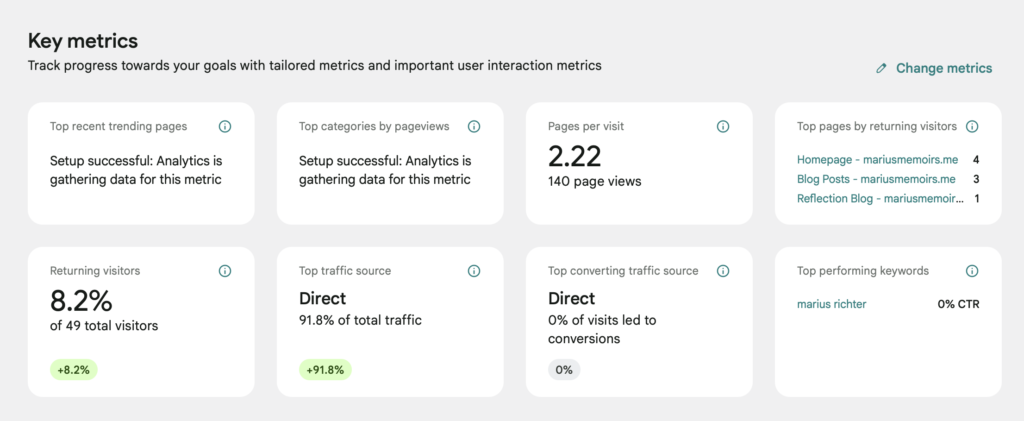
The Site Kit starts you off with key metrics. My findings where: I had accumulated 140 page views, 2.2 pages visited per visit, that my most visited pages by returning visitors where my homepage (4 visits) and secondly my blog posts page (3 visits). Furthermore I had a total of 49 visitors, with 8,2% returning to view my site again. It made my traffic source out be direct traffic with a total traffic of 91,8%. Lastly top performing key words were my first and last name.
Following the key metrics it presented me with a graph titled “find out how your audience is growing.”, which gave me insights on my total visitors, 49, and when I had the most visitors in one day since I published the website. The program made the day out be march 30th with the amount of visitors being 15. Next to the graph was a circle providing insights on channels, locations and devices. 90% visited the website directly, 8% by e-mail and 2% were unassigned. Top countries were made out the France, Netherlands, Ireland and Germany, while 83% visited on their desktop and only 17% per mobile.
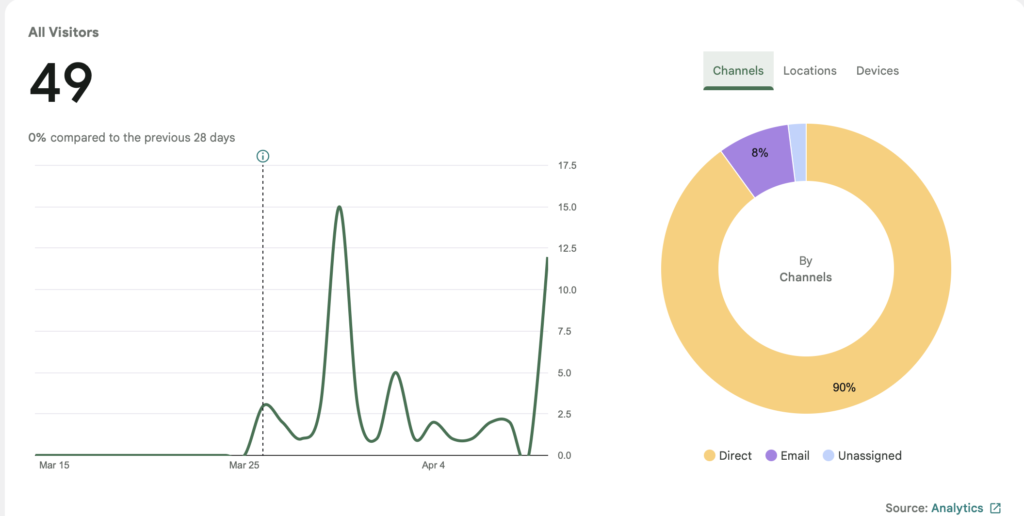
Additionally the Site Kit gives you more insights about your total visitors and your returning visitors, like visits per visitor, total page views, top cities, etc. These top cities were made up of Cork, Dublin and Amsterdam.

The next category addressed by the Site Kit showed your content interaction (engagement rate, conversion rate, top searches, etc.). My highest page views came through my homepage with 88 views and and engagement rate of 40%. The highest engagement rate in. correlation to page views was recorded on my blog posts page with 88%.

One option the site kit offered which I couldn’t profit of was Google ads. On this you can monitor your monitization and configure where ads are displayed on your site.
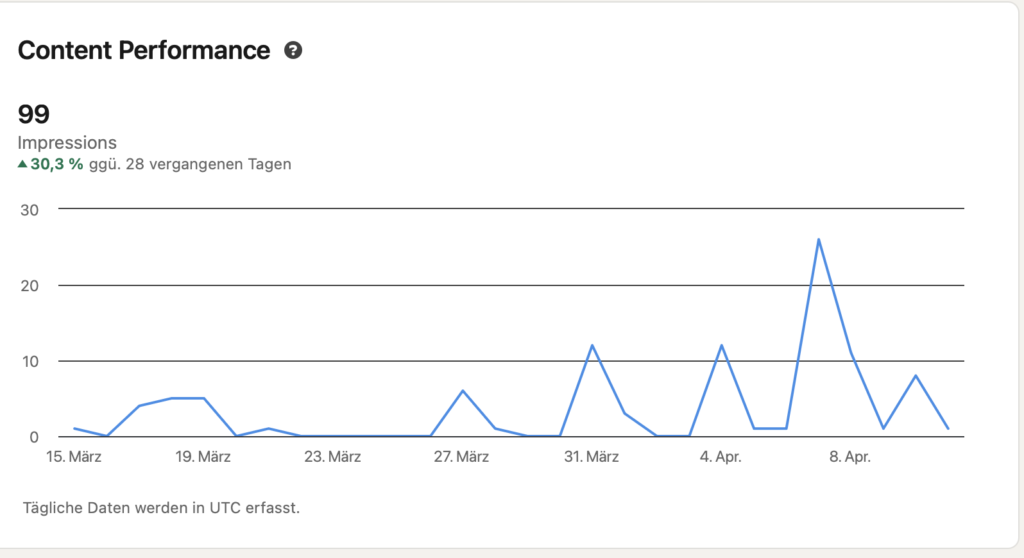
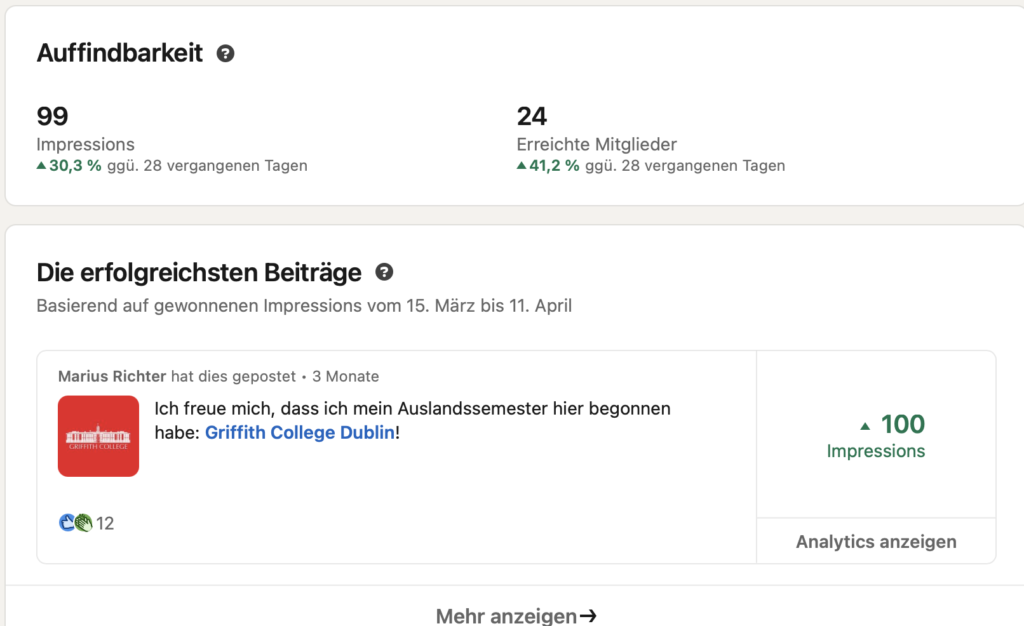
After the Site Kit I wanted to look at my LinkedIn analytics. They showed me my content performance over the last month and how many I had made. Furthermore I saw how many members I was able to reach and what my most popular post was. I had made 99 impressions, reached 24 members and had more than 100 impressions on my most popular post.
Through all of these analytics tools it is extremely easy for a host to monitor his websites success and also see how well his personal brand performs. These tools helped me immensely when it came to understanding what it meant to have your own website and everyone should be utilizing them to their maximum extent.